Monitoring and debugging AI agents in production
Tools, dashboards, distributed tracing, and practical recovery tips for keeping autonomous agents reliable.
Why Traditional Logs Are Useless for Autonomous Agents
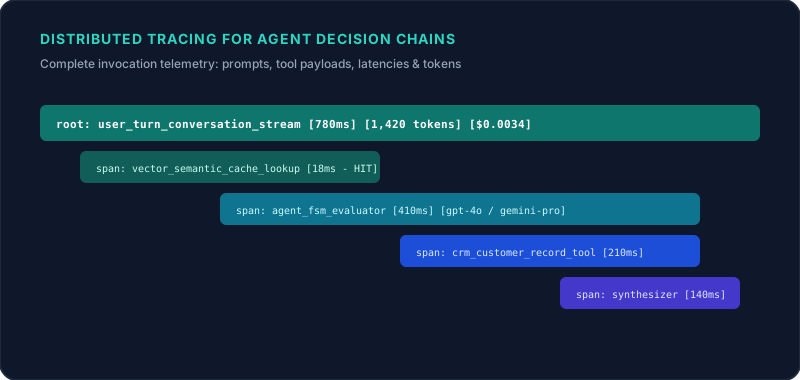
Traditional plaintext server logs cannot capture the semantic branches of an autonomous AI agent. When an agent executes a multi-step task that touches three databases, calls two external APIs, and reflects on intermediate outputs, looking at isolated log lines is like trying to reconstruct a movie from a handful of individual frames.
In standard web applications, a request enters a controller, queries a database, and returns a JSON payload. The execution path is deterministic and linear. In an agentic architecture, a single user prompt might trigger 4 tool calls, 3 internal semantic reflections, a transient timeout retry, and a conversational fallback.
Without distributed span trees that link prompts, tokens, schemas, and API latencies to a unified trace ID, debugging customer escalations is nearly impossible.
Never deploy an agent without linking every LLM call, vector retrieval, and tool execution under a single distributed OpenTelemetry trace hierarchy.
Instrumenting Agent Execution with OpenTelemetry
We structure our observability around native OpenTelemetry semantic conventions tailored for generative AI. Every conversational turn creates a root span, with nested child spans for vector retrieval, prompt compilation, LLM token generation, tool serialization, and state validation.
// OpenTelemetry agent span instrumentation
import { trace, SpanStatusCode } from "@opentelemetry/api";

const tracer = trace.getTracer("ai-agent-engine");

export async function executeMonitoredTool<T, R>(
  toolName: string,
  args: T,
  fn: (args: T) => Promise<R>
): Promise<R> {
  return tracer.startActiveSpan(`agent.tool.${toolName}`, async (span) => {
    span.setAttribute("ai.tool.name", toolName);
    span.setAttribute("ai.tool.args_bytes", JSON.stringify(args).length);
    const startTime = performance.now();

    try {
      const result = await fn(args);
      span.setAttribute("ai.tool.latency_ms", performance.now() - startTime);
      span.setStatus({ code: SpanStatusCode.OK });
      return result;
    } catch (error) {
      span.recordException(error as Error);
      span.setStatus({ code: SpanStatusCode.ERROR, message: (error as Error).message });
      throw error;
    } finally {
      span.end();
    }
  });
}
The Four Production Metrics That Actually Matter
Most monitoring dashboards track generic operational metrics like HTTP 200 error rates and CPU usage. While necessary, those metrics tell you nothing about whether your agent is actually serving customers or hallucinating in a polite loop.
The real indicators of agent production health are:
• Semantic Drift Rate: The percentage of conversations where the customer has to say 'No, that is not what I asked' or rephrase their original intent. • Tool Retry Ratio: The average number of attempts an agent takes to successfully emit a valid schema payload before succeeding or aborting. • Token Burn Per Resolved Outcome: The total tokens consumed divided by the count of successfully executed customer intents (not total sessions). • P95 Time-to-First-Token (TTFT): The responsiveness of streaming token generation under high concurrent traffic.
Real-Time Anomaly Detection & Circuit Breakers
One of the scariest failure modes in production is an agent entering a tight recursive loop with an external API. If a customer provides ambiguous input and the model attempts 10 tool calls in 30 seconds, it burns dollars and overwhelms downstream microservices.
We enforce automated runtime circuit breakers: if an agent invokes the same tool three consecutive times within a single turn, the engine aborts execution, emits a structured anomaly alert to PagerDuty, and routes the caller to a graceful fallback message.
Deterministic Session Replay in Local Sandboxes
When an enterprise customer reports an unexpected agent response, our telemetry logs allow developers to download the exact turn state, mock external API dependencies with recorded payloads, and re-run the session locally. This turns elusive LLM bugs into reproducible test cases that can be solved and guarded in hours.

Rohit Anand
Engineering Leader & Builder building enterprise platforms, Voice AI, and Agentic systems. Dedicated to evolutionary architecture, team judgment, and delivery excellence.